Algorithm builds maps predicting overall state of environment based on available measurements
Skoltech researchers have come up with an approach for aggregating and mapping data on the quality of water, soil, or air for agriculture, industrial needs, consumer and environmental protection.
The new algorithm relies on readings from multiple isolated measurements of pollutant levels and other parameters at various locations to predict and visually map how each parameter - e.g., concentration of heavy metals - varies throughout the surrounding region. The solution then uses the data from environmental standards and regulations to combine the individual maps into a single one showing the overall quality of water, soil, or air that takes all of the parameters into account. The study came out in Scientific Reports.
Image credit: Pixabay (Free Pixabay license)
"Humans disrupt and pollute natural environments: soil, water, and air - and we need to be able to monitor and evaluate that, both to protect the environment in an efficient way and to make use of the available resources," study co-author Polina Tregubova of Skoltech said. Ideally, you would have a map for each region that details the results of many sample analyses at every point, but that is clearly not an option, because you would have to make infinitely many measurements on location.
"We address this by running something called 'interpolation.' It's a procedure that uses the available data from samples in the region to fill in the gaps and guess the values of all parameters where we don't know them," the lead author of the paper, Skoltech PhD student Artyom Nikitin, added. By virtue of data interpolation, the researchers' algorithm produces a map of the region for each parameter of interest - for example, a water acidity map - with 100-square-meter resolution.
The solution does much more than that, though. Once it has predicted the continuous variation of the parameters of interest that characterize the quality of water, soil, or air in the region, it uses what the researchers privately refer to as a "fancy data aggregation technique" to come up with a measure of overall quality of the environment that integrates all the parameters used. And it maps that
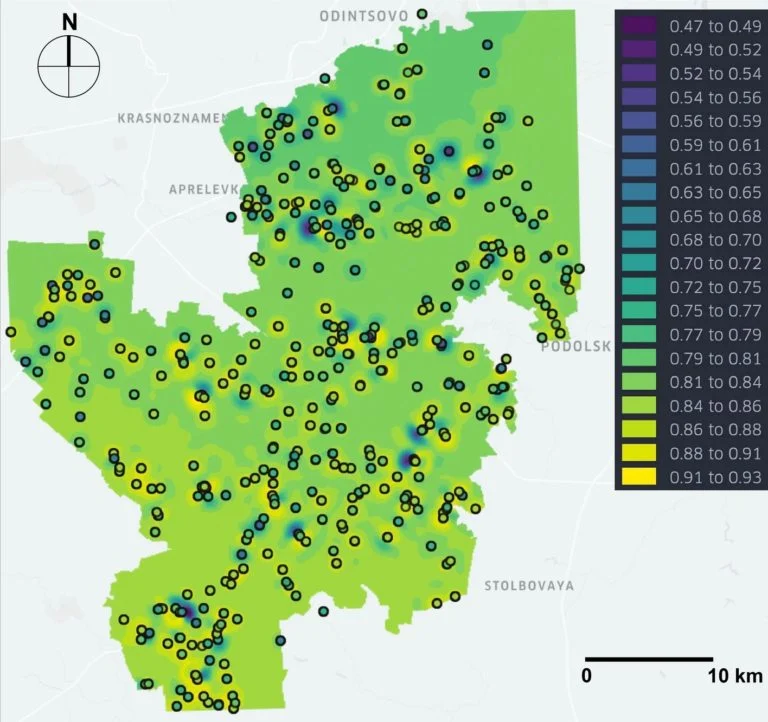
A map generated in the study color-coding water quality in the New Moscow region: from dark violet for low to yellow for high. New Moscow refers to the former suburbs that were incorporated into the city in 2012. It spans about 1,500 square kilometers and has more than doubled the size of the Russian capital. The map draws on data from 1,526 samples taken at 448 locations and spanning 21 analytical parameters. Credit: Artyom Nikitin et al./Scientific Reports
Aggregation depends on the requirements from the environmental standards that we have to feed in. In the study, those were water quality regulations, but any similar standards, say, for cultivated soils would work, too," the researchers explained. "So the beauty of this solution is that it's flexible enough to be scaled up to any region where you have a reasonable amount of sample measurements and any kind of environment for which there are standards issued by the WHO, national governments, or corporations. It's very convenient and very flexible."